|
Copyright ©2015 by Paul Niquette. All rights reserved. |
|
Copyright ©2015 by Paul Niquette. All rights reserved. |
 Sophisticated
solvers will want take into consideration all three
variables in the fundamental equation, speed = flux / density.
Increasing separation of stopped vehicles reduces
traffic density -- of stopped vehicles
only. Sophisticated
solvers will want take into consideration all three
variables in the fundamental equation, speed = flux / density.
Increasing separation of stopped vehicles reduces
traffic density -- of stopped vehicles
only. The density and therefore the speed of vehicles traveling in steady-state will not be affected. Ah, but freed from density lock, vehicles are able to accelerate faster from a standing stop and reach steady-state speed sooner. As for the capacity of the traffic system, the instantaneous flux is zero for stopped vehicles at any density, but quicker restoration to non-zero flux would seem to be an advantage of increased separation of stopped vehicles; however... Increasing the separation of stopped vehicles means that, while stopped, they are farther away from their ultimate destinations. That reality flies in the face of elementary -- not to say primitive -- psychology of drivers and passengers. Back in 1955, objections were loud.The idea for increasing stopped separation followed from UCLA's proposal for the earliest ramp metering. People would scoff, "How do you expect to speed up a system by deliberately slowing it down." Similarly, responses to the proposal for mandating separation took the form, "Reducing density means each vehicle takes up more 'real estate' in its lane." Which is true enough, but certainly no more 'real estate' than when the vehicle is happily traveling in steady-state at safe following distance. Here is the question in the puzzle...
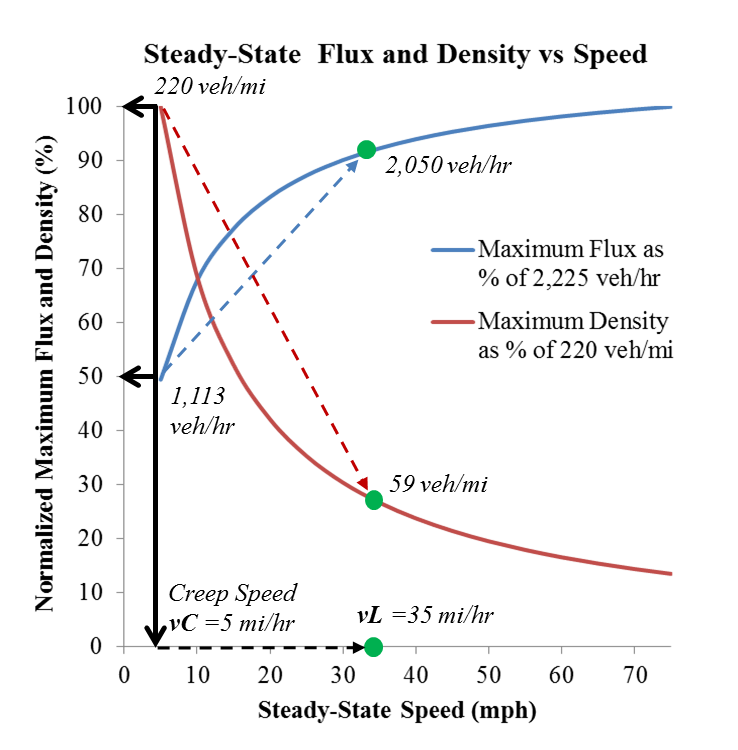
Let us explore some implications of
our thought-experiment, using the parameters in the
table below. We see that in steady-state speed =
35 mph, flux
= 3,600 / tH = 2,045 veh/hr, density = 5,280
/ xH = 59 veh/mi.
The base case has xS = 2 ft and the experimental case has xS = xF / 2 = 39 ft for vL = 35 mph. We can readily calculate the densities for the stopped separations as 352 veh/mi and 102 veh/mi respectively. In the base case, vehicles are density locked, inasmuch as there is insufficient space for immediate acceleration. Routine stops are not common on expressways, freeways, and throughways. Today's highways do suffer plenty of congestion, however, as lane capacities are routinely exceeded by peak traffic demands. Any sudden interference in flow can cause a traffic jam on the highway, and the resulting density lock can linger long after the cause of the jam has been cleared up. This subject will be addressed in the Density Wave puzzle. Not
much can be done about jams -- not by individual drivers,
anyway. The main concern is that braking of each
vehicle must be adequate throughout the whole
platoon. The postulation page of the Density Lock puzzle, confirmed that
requisite braking bN < b(N-1).
Once those vehicles are stopped, though, the flux for
that lane is zero. Best anybody can hope
for is to restore a non-zero traffic flux as rapidly as
possible when the lane ahead opens up. Here we see graphs of the accelerations and recovery times using aN = a0 vL2 / [vL2 +2 N (xF - xS) a0].   As for comparing the overall speed for individual vehicles between the two cases, skeptics might ask, "Since prevention of density lock in the experimental case forces each vehicle to start up from 37 feet farther back, won't that increase time-to-destination?"Not so much. Sophisticated solvers will merely multiply the net recovery time for a given vehicle by the steady-state speed, which represents the extra distance traveled at 35 mph and compare that to the cumulative separation distance for that vehicle. Those two distances are exactly the same for every vehicle in the platoon. By the way, that equivalence will apply to any separation between stopped vehicles. Hmm. Skeptics will also point out that freedom from density lock requires the stopped platoon with 10 vehicles to stretch back from the stop line 390 feet, about the length of a city block.So what? About 32 seconds after the light turns green, all 10 vehicles will have accelerated to 35 mph. During that time they will spread out along the traffic lane to 900 ft or two tenths of a mile. That happens to be twice the 'real estate' when stopped and exactly the same as if there had been no red signal at all. Creep-to-the-Stop-Line
Here
is an alternative modeling concept for the base case
as mentioned in Density Lock puzzle.
Instead of a constant accelerations aN,
each vehicle other than N=0, is assumed
to creep forward as allowed by the instantaneous
location of of vehicle N-1 ahead.
 The assumption in the graph is
that, after the traffic light changes from red to
green, each vehicle is able to progress forward to
the intersection stop-line at some average 'creep
speed' vC. At a density
of about 220 veh/mi (24 ft/veh) and a flux
of 1,113 veh/hr (3.2 sec/veh), vC
= 5 mi/hr (7.3 ft/sec). Keeping xL
= 13 ft, the following-distance-while-creeping
averages xF = 11 ft.
Using the constant-acceleration results for the base case, which show a recovery time for the 11-vehicle platoon of 32 seconds, we can estimate the result for a creep-to-the-stop-line by calculating the creep-time tC for the the n=10 vehicle as 10 x 24 / 7.3 = 33 sec. Assuming an acceleration a10 = a0 = 16.1 fpsps, the recovery time at 35 mph = 33 + 51/16.1 = 36 sec, which is only a few seconds slower than the results from the constant acceleration model.One is tempted to conclude that the advantage in the experimental case has been slightly strengthened by this calculation; however... Escape-Time
Solvers
of the Density
Lock puzzle have identified a
villain in congested flow -- density.
High density means low speed; low
density means low flux, the
former relevant to traffic-system users,
the latter to traffic-system
managers. Both speed and flux
put time in the denominator.As we have discovered in several puzzles, it is generally a good idea to put time in the numerator. Recovery time does that here in the Density Lock puzzle. It does something else, too. We have been made aware of a potentially relevant criterion for judging the results.So far, 'recovery-time', has been taken as the interval that begins with the instant the traffic signal changes from red to green and concludes when the last vehicle in a platoon has accelerated to the speed limit. Limited by density lock, the base case vehicles take more time than the experimental case vehicles, which are starting up from separated locations. Though they have been stopped at greater distances from their respective destinations, we have shown that when the light changes from red to green, the vehicles in experimental case do not suffer a time penalty in reaching those destinations; however... Many of the 'recoveries' lie beyond the intersection, where any number of unanticipated interferences might delay recovery. One can argue that the system being modeled is therefore incomplete -- that all relevant factors for judging the efficacy of mandating stopped separations are situated before the intersection is reached. That argument leads to a different criterion...The escape-time criterion simple measures the time for each vehicle to reach the stop line at the intersection. It regards the transportation system as being 'responsible' for managing the movement of vehicles only in their respective approaches to an intersection not beyond. We can easily calculate the time required for the last vehicle in a platoon to reach the stop line at the intersection -- the escape-time tE. Base Case: At the instant the light changes from red to green, vehicle N=10 is stopped at 10 x 15 = 150 ft from the stop line. At a10 = 0.6 g (19.3 fpsps), it accelerates to vL = 35 mph (51 fps) in 51/19.3 = 2.6 sec and traveled 512/2(19.3) = 67 ft, leaving 150-67=83 ft to travel at vL to reach the stop line, for an escape time tE = 2.6 + 83/51 = 4.2 sec.Thus, if the criterion for judging recovery-time is escape-time, the model shows that the proposal fails; however... Base Case with Creep-to-the-Stop Line: At the instant the light changes from red to green, vehicle N=10 is stopped at 10 x 15 = 150 ft from the stop line. The model has been adjusted to accommodate creeping at vC = 5 mph (7.3 fps). The 150 ft requires tE = 20.5 sec....which indicates that creeping-to-the-stop line is not the best way to overcoming density lock. Your puzzle-master, who now lives in France, has observed that French drivers spontaneously stop with xS > 2 ft in approaching intersections -- perhaps as much as xS = 2.0 meters (6.5 ft), which allows for a faster creep speed vC > 5 mph (8 km/hr) -- possibly as much as 10 mph (16 km/hr). Thus, we might consider... French Case with Creep-to-the-Stop Line: At the instant the light changes from red to green, vehicle N=10 is stopped at 10 x 18 = 195 ft from the stop line. The model can be adjusted to accommodate creeping at vC = 10 mph (15 fps). The 195 ft requires tE = 13.3 sec, which agrees with the Experimental Case within a couple of seconds. Exclamation point anyone? Over a period of 20 years, France has been appropriating and applying one traffic management technology which implements an elegant stratagem for eliminating density lock. Sophisticated solvers will learn about why that technology is so successful while solving...
|