|
Version 2.1 Copyright ©2018 by Paul Niquette. All rights reserved. |
|||||
Challenged by the puzzle, we find ourselves called upon to to answer this question... What is the effect of the Rond-Point on vehicular
Speed?
Vehicular
speed,
measured in mi/hr, and
flux, measured
in veh/hr, are
limited by density,
measured in veh/mi.
and
density is
itself a function of
both speed
and flux.
Go
figure.
...by comparing its performance to that of a conventional intersection. Indeed, speed = flux / density and flux = speed x density. 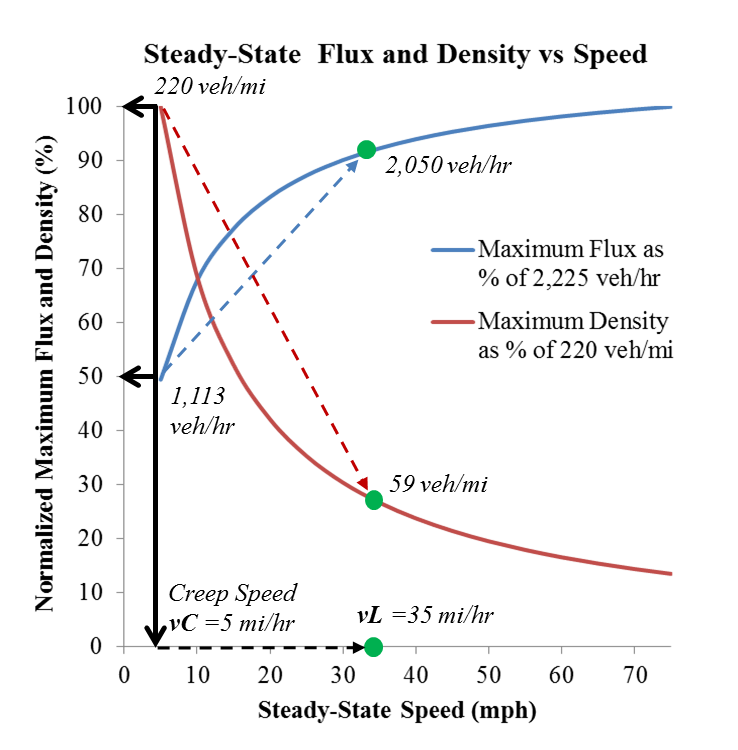 Solvers of the Density Lock puzzle will recognize this graphical representation of the limits imposed on traffic performance by density. The green dots mark a particular case in which vehicles are indicated as obeying speed limit vL = 35 mi/hr in a single roadway lane. Traffic density at that speed is limited to 59 veh/mi -- in what is called 'congested flow'. That is about 30% of what can be accommodated by a lane full of vehicles operating at creep speed vC = 5 mi/hr or below, which amounts to 220 veh/mi. We observe that in 'congested flow' with speed = 35 mi/hr, a lane can accommodate a maximum flux = 2,050 veh/hr. That is about 90% of what is typical of a limited-access expressway, which can handle some 2,300 veh/hr per lane at 33 veh/mi. 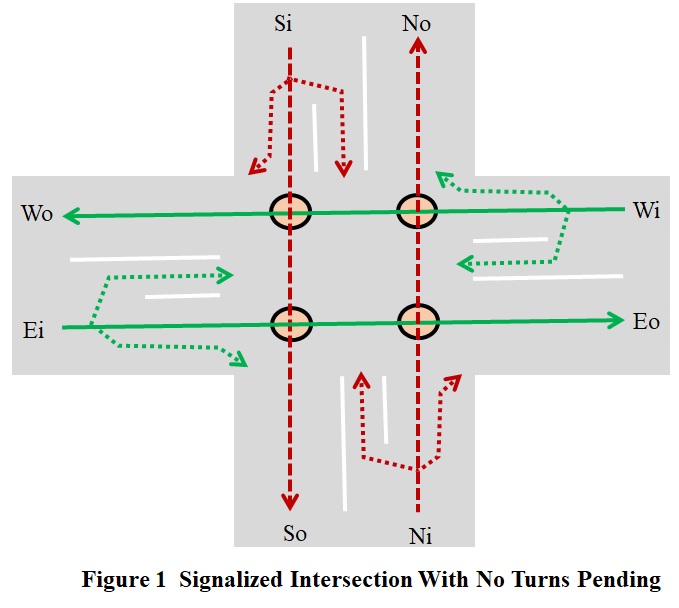 Figure
1 reprises a simplified intersection
with only straight-through traffic. Figure
1 reprises a simplified intersection
with only straight-through traffic.Vehicles on Wi and Ei are being given green signals as indicated, and they can pass through the intersection without slowing. Meanwhile vehicles on Si and Ni are being given red signals and must stop without entering. Let us assume that the traffic 'aspects' reverse on one-minute cycles. In 'congested flow', theoretically a maximum of 2,050 / 60 = 34 vehicles will pass through the intersection during each green interval. Meanwhile, in congested flow, 34 vehicles will be stopped in a queue (platoon) to wait out each red signal. These are oversimplified estimates, of course. As analyzed in the solution to the Density Lock puzzle, additional time must be allowed to bring vehicles to a stop and to clear the intersection of vehicles in a platoon, operating at vC and then accelerating to vL. Many relevant cases can be represented by non-congested flow. Let us suppose, for example, that density = 12 veh/mi (roughly one-fifth of the maximum for 35 mi/hr). Fewer than two vehicles per minute show up for either green or red signals. The latter must remain stopped a full minute, during which fewer than two vehicles will pass through the intersection. Red signals can keep the intersection almost empty, reducing its traffic flux to near zero. 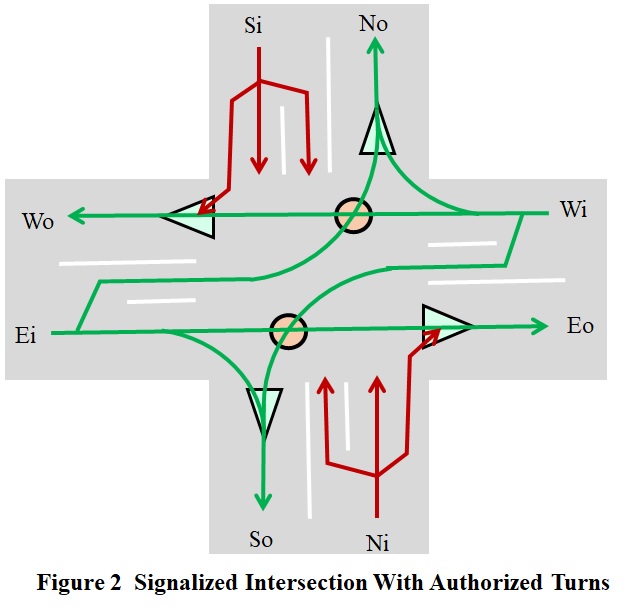 Figure 2
reprises the same simplified intersection, now
depicting turns, along with straight-through
traffic. Figure 2
reprises the same simplified intersection, now
depicting turns, along with straight-through
traffic.Here one can see a performance shortcoming in the left-turning procedure. Whereas it is forbidden to enter an intersection on a red signal, getting caught in the middle of an intersection when the signal changes to red is a common experience. Such is often the case for a left-turning vehicle -- plus its consequent queue -- which must wait for an opening in on-coming traffic. The result is delay in the release of cross-traffic under its green aspect. Performance of an Intersection can be judged by the average speed of vehicles that pass through it. Solvers of several puzzles, for example Train Speed, have discovered the need to put 'time in the numerator' for calculating average speeds. That is what we shall do here. Let us make the following assumptions, intentionally generous to intersection performance:
The total distance covered by the 'leader' during the red sequence described above can be calculated as xS = 3.2 x 162 = 819 ft. That distance is accompanied by a total elapsed time of tS = 60 + 16 = 76 seconds. Meanwhile, vehicles with the green signal will cover that same distance, xS = 819 ft, at vL = 51 ft/sec in 819 / 51 = 16 seconds. Accordingly, vehicles pass through the intersection in either 76 seconds or 16 seconds. With time in the numerator, we calculate the average elapsed time as (76 + 16) / 2 = 46 seconds, for an average speed given by (819 / 46)(3600 / 5280) = 12 mi/hr. 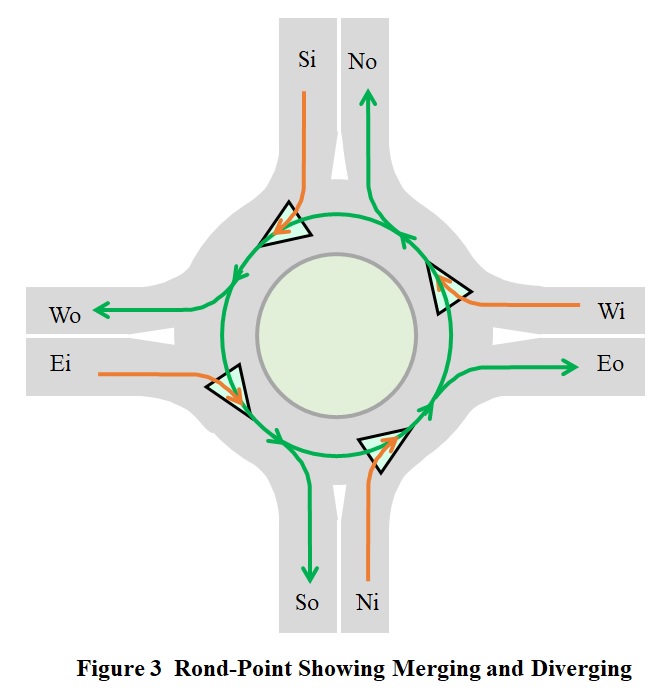 Figure
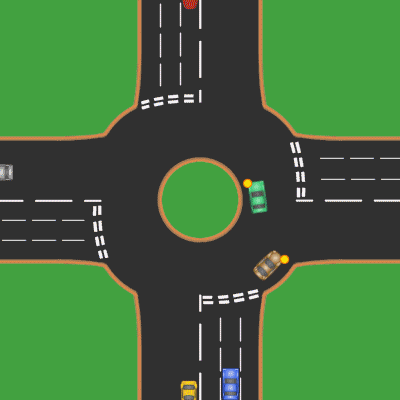
3 reprises the Rond-Point Figure
3 reprises the Rond-Point
which was postulated in the puzzle to replace the intersection shown in Figures 1 and 2 above. In the absence of traffic signals, vehicles can flow continuously into and out of the circle, limited by the flux that can be accommodated in the circle itself. Vehicular speed is also limited by the diameter of the circle. Merging of vehicular flows are shown at four points. We observe that for straight-through traffic, each incoming lane must yield to only one other incoming lane, which is already established in the circle: Si yields to Wi, Ei yields to Si, Ni yields to Ei, and Wi yeilds to Ni. Performance of a Rond-Point can be judged by the average speed of vehicles that pass through it. For comparison with the performance of the intersection above, let us make the following assumptions, which are intentionally ungenerous to the rond-point:
Epilog:
Just for fun, let us trace the eight vehicle pathways as shown in the animation…
Right Turning:
Straight Through:
Left Turning:
U-Turning The success of the rond-point here in France may be attributable to one salient observation: In six years, I have never seen any vehicle pass another on the right. Not even once.Sophisticated solvers may want to confirm for themselves that the multi-lane conventional intersection suffers a worse performance comparison than the single-lane analysis evidenced above. Hint: To accommodate left turns, a green aspect must be periodically given to one pair of lanes, which necessitates prolonged red aspects for all other lanes in the intersection. Finally, there is the matter of right-signaling approaching outgoing lanes, which is offered mostly as a courtesy to vehicles waiting at an incoming lane. An optional courtesy, it seems. There is a bit of hazard to consider. If right-signaling for an upcoming exit is inadvertently offered too early the driver of an entering vehicle might stop yielding right-of-way and try to enter the circle. In such a case, it would have been safer not to signal at all, which will merely result in a few seconds of stop-time for the entering vehicle.
|